Analytics
Prefer to see it in action? Open the guided walkthrough — an animated, click-by-click tour you can play automatically or step through yourself.
Analytics turns your Amazon data into decisions: what to restock, what actually makes money after fees, how often you win the Buy Box, and what has shipped from FBA. Every tab can be exported to CSV. Analytics is available on the paid plans.
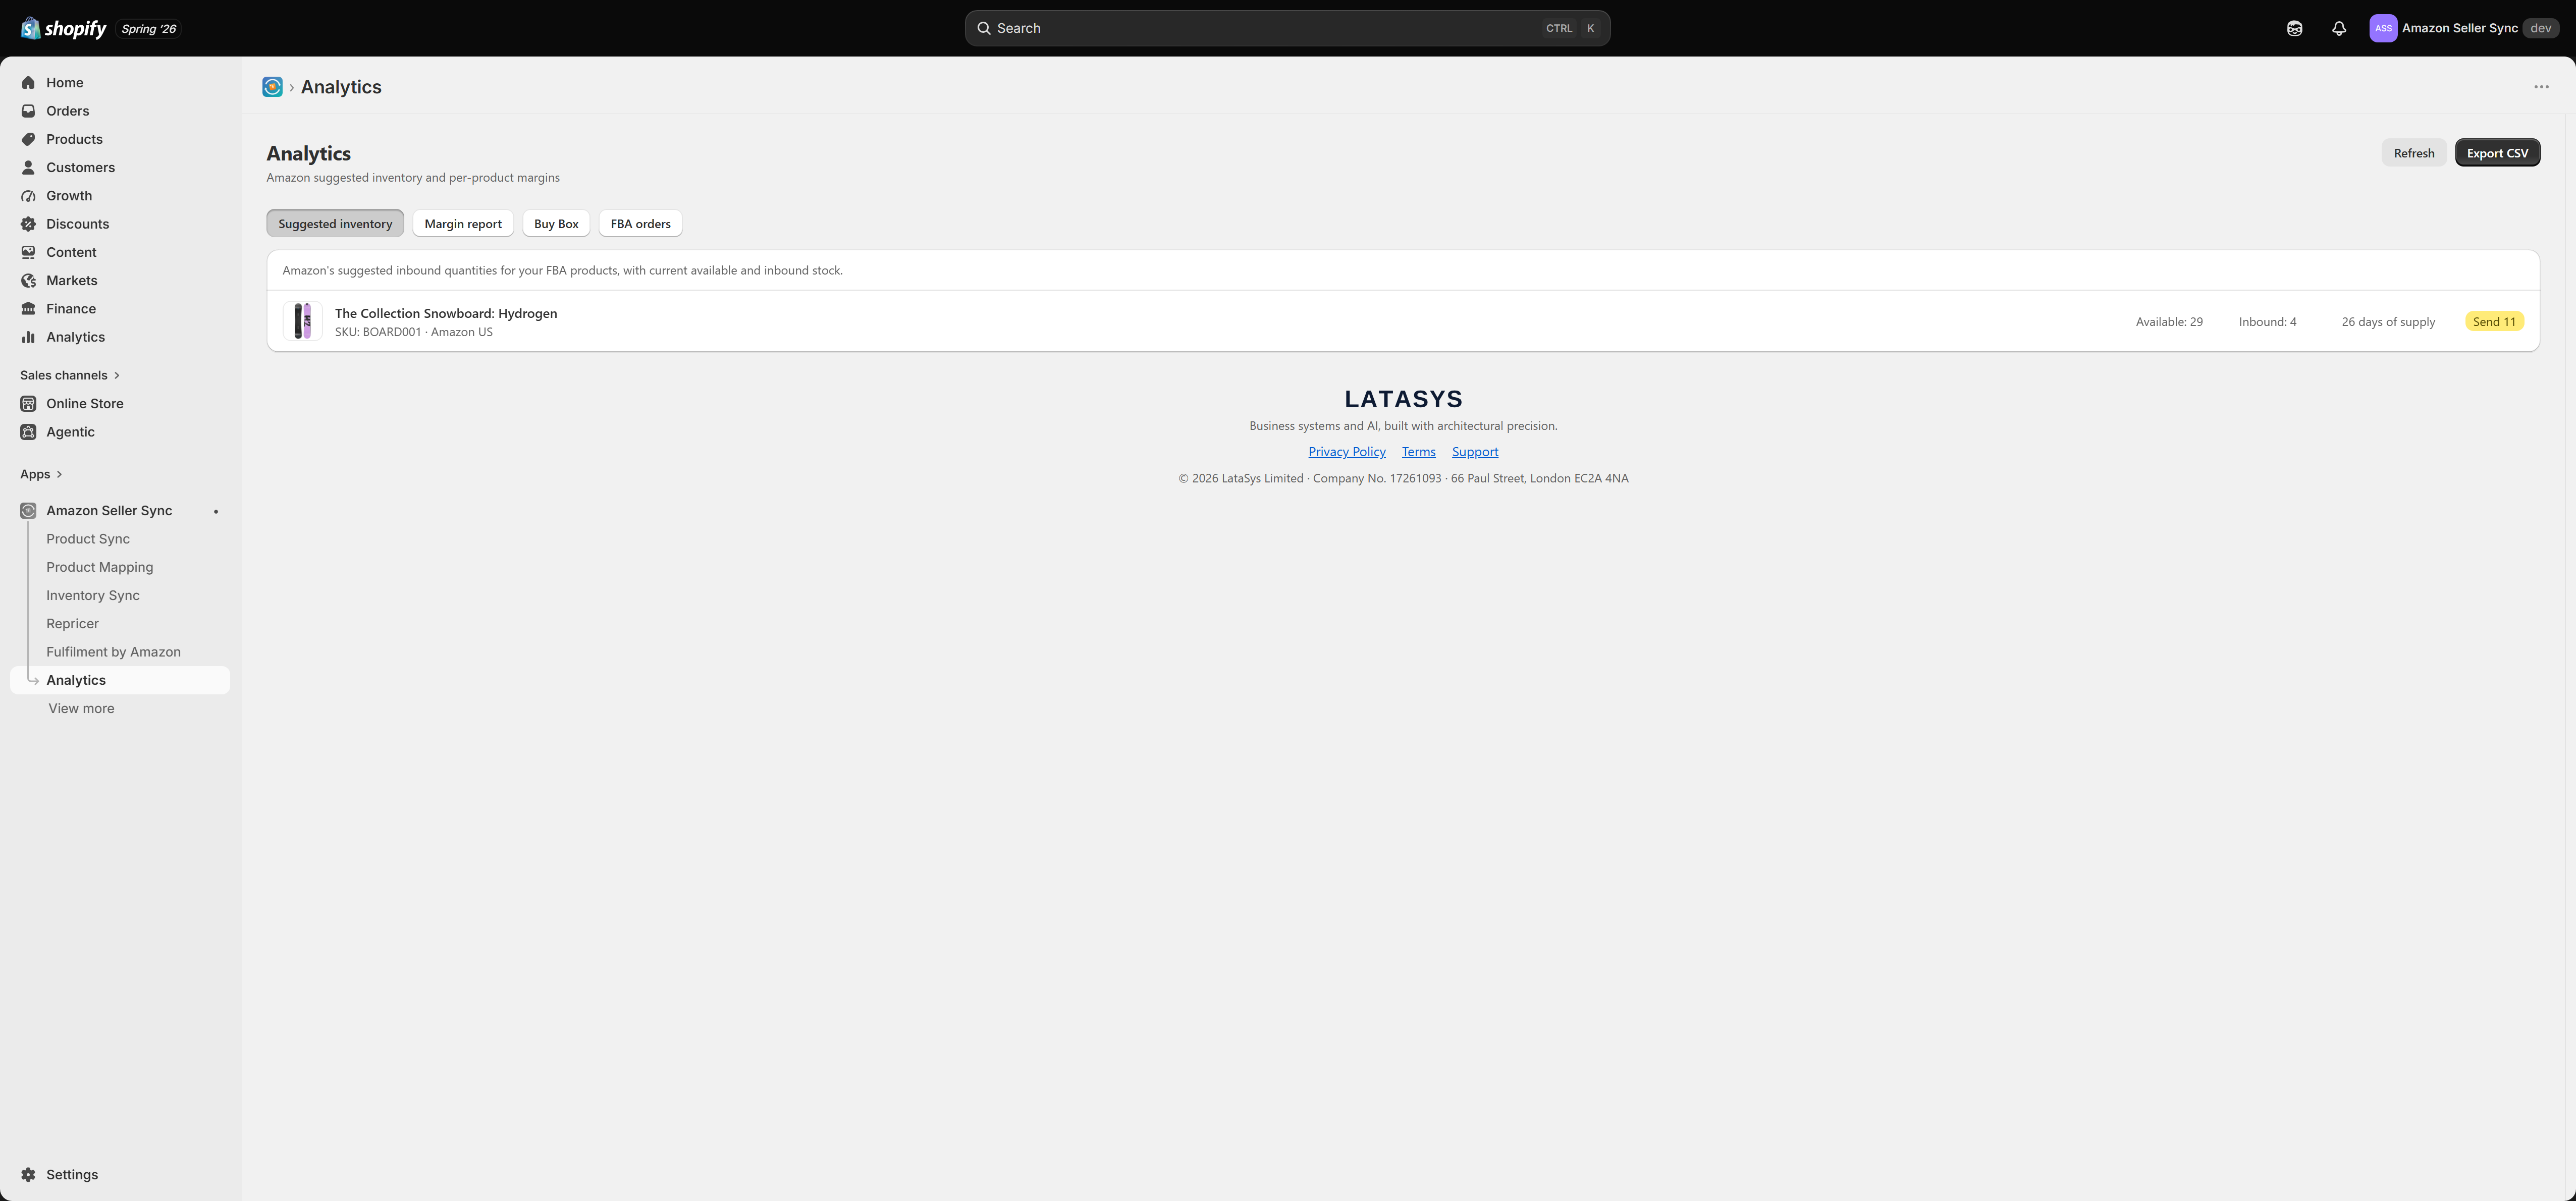
Suggested inventory
Amazon's suggested inbound quantities for your FBA products, alongside current available and inbound stock. Each row shows the product and SKU, the marketplace, Available and Inbound units, an estimated days of supply, and a suggested Send quantity so you can plan a shipment before you run out.
Use this tab to keep FBA stocked without over-committing inventory.
Margin report
A per-product profitability view: your price minus Amazon's fees minus your cost. This is the honest picture of what each listing earns after referral and fulfilment fees, so you can spot products that look like sales but lose money, and price or drop them accordingly.
Buy Box
Your Buy Box win-rate over time. Choose the period to see how your share of the Buy Box has moved — useful for measuring the effect of the Repricer or a pricing change. Products where you are losing the Buy Box, or losing margin to win it, are flagged.
FBA orders
Recent orders fulfilled from Amazon FBA, so you can reconcile Amazon fulfilment activity without leaving Shopify.
Exporting
Export CSV downloads the current tab's data so you can work with it in a spreadsheet or share it with your team. Refresh pulls the latest figures from Amazon.
Analytics reflects your mapped and listed products. The more you map in Product Mapping and publish in Product Sync, the more complete these reports become.